Note: this was originally written the week prior to the 2019 Iron Bowl. I have updated all dates, wins, numbers, and calculations with results leading up to the 2024 Iron Bowl.
As of the 2024 season, Auburn and Alabama have played each other in the game of football a total of 88 times. We know the story: the two schools met for the first time in 1893 and played every year up until a 6-6 tie in 1907. Due to petty reasons, the game would not be played again until 1948. The teams have played every year since.
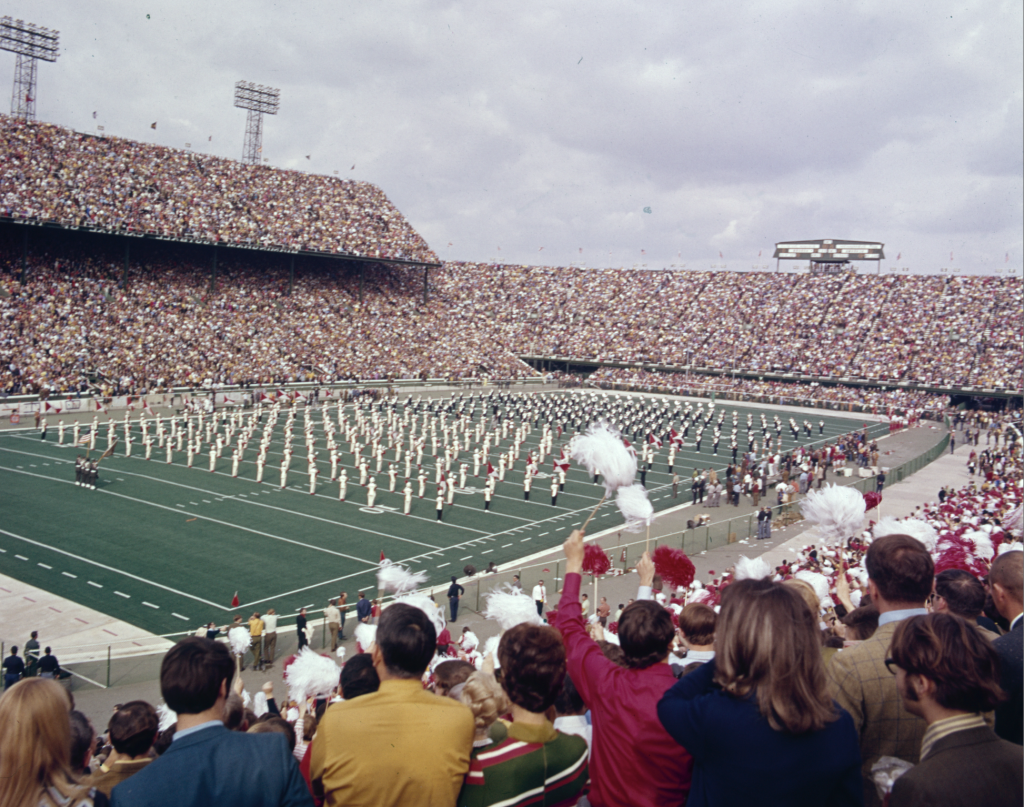
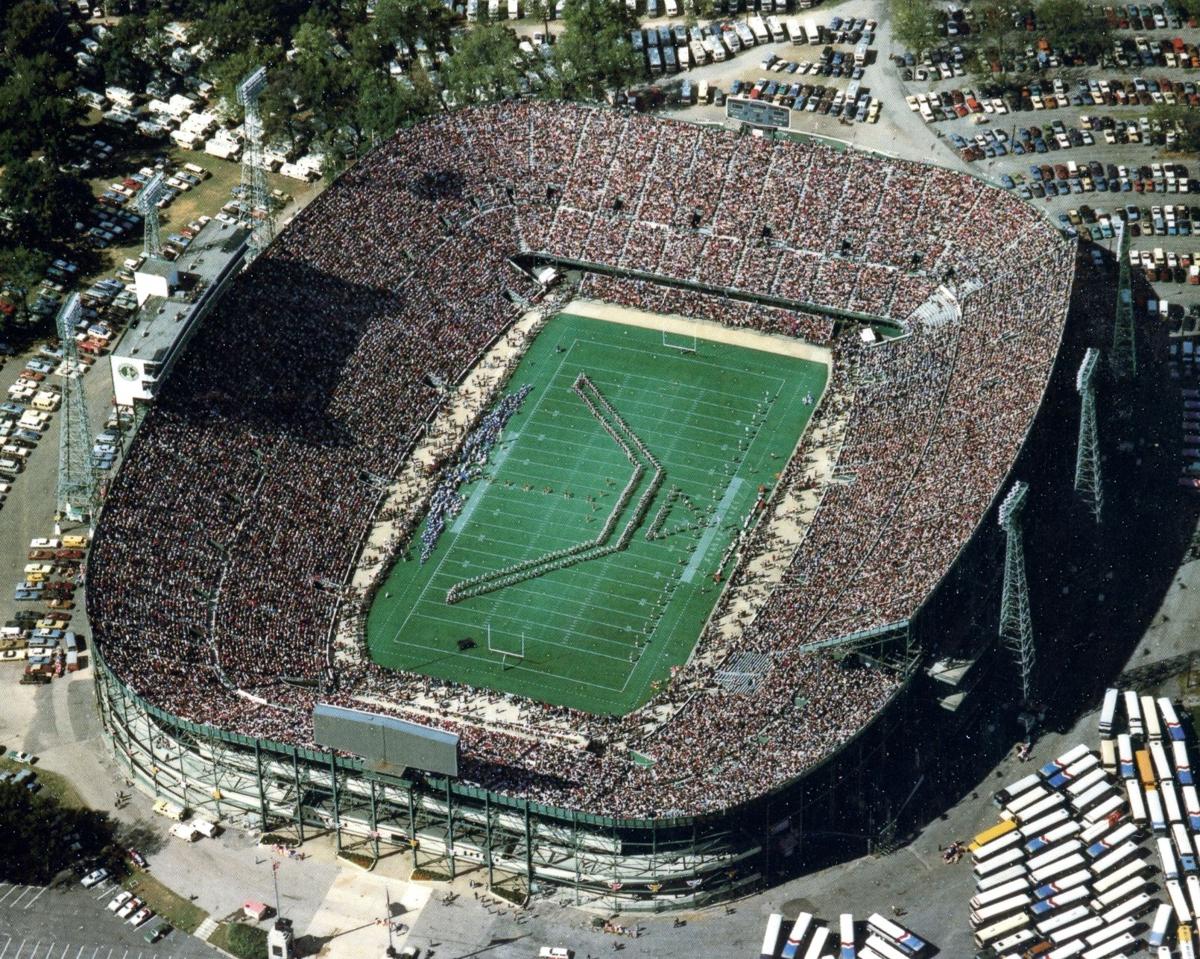
Of the 88 Iron Bowls, 4 were played in Montgomery, 14 have been played in Tuscaloosa, 17 have been played in Auburn, and 53 were played in Birmingham. For those that are new to this, the Iron Bowl spent most of its history in Birmingham because it housed the biggest and best stadium at the time. It was also seen as a good, neutral spot centrally located in the State of Alabama. However, for decades Alabama used Legion Field as an “alternate” home field for most of their games.
According to Wikipedia (founded by an Auburn and Alabama alum)…
Well into the 1980s, Alabama played most of its important games, as well as the Iron Bowl, at Legion Field—to the point that most of Alabama’s “home” football history from the 1920s to the 1980s took place in Birmingham. At its height, it seated 20,000 more people than the Tide’s on-campus stadium, Bryant–Denny Stadium. Additionally, Birmingham was more accessible than Tuscaloosa for much of the 20th century—even though Tuscaloosa is only 45 minutes west of Birmingham … Alabama also played its entire 1987 home schedule at Legion Field due to major renovations at Bryant–Denny Stadium. Indeed, the stadium’s strong association with Alabama football led Auburn to lobby to have its home games in the Iron Bowl played in Auburn.
So basically, until Pat Dye freed Auburn from the Old Gray Lady in 1989, the series was regularly played in Alabama’s home stadium. Seems fair, right?
By the law of how sports work, the team playing the most games of a series in their home stadium will naturally and almost always lead that series. Therefore, Alabama currently owns the series record at 50-37-1.
But let’s take a deeper dive into the numbers, specifically winning percentages based on location, and see what’s really going on here. Update: The numbers in the grids below have been updated through the 2023 season. Given that there have only been 5 games since in the years following the original post date, the numbers have not significantly changed.
| Location | Games | AUB | Win % | ALA | Win % | Ties |
| Birmingham | 53 (61%) | 18 | 34% | 34 | 64% | 1 |
| Auburn | 16 (18%) | 10 | 59% | 7 | 41% | 0 |
| Tuscaloosa | 14 (16%) | 7 | 50% | 7 | 50% | 0 |
| Montgomery | 4 (5%) | 2 | 50% | 2 | 50% | 0 |
| Totals | 87 | 37 | 43% | 50 | 57% | 1 |
What you’ll see above is that Auburn has won almost 2/3 of the games played in Auburn. You’ll also see that Alabama has won almost 2/3 of the games in Birmingham. So why does Alabama have more wins than Auburn? Because they got to play 2/3 of the games in the series in their “alternate” home stadium. Note: since 2005, home teams in college football have won 59.2% of the time. Auburn and Alabama have been better than that within the Iron Bowl specifically.
To make it easier, let’s combine the numbers for Birmingham and Tuscaloosa. The Tide hosted Iron Bowls in their hometown stadium way back in 1895, 1901, and every other year since 2000. They might not like to see this, but their home field advantage hasn’t been helped by playing on campus.
| Location | Games | AUB | Win % | ALA | Win % | Ties |
| Bham/Tuscaloosa | 67 | 25 | 38% | 41 | 62% | 1 |
| Auburn | 16 | 10 | 59% | 67 | 41% | 0 |
| Montgomery | 4 | 2 | 50% | 2 | 50% | 0 |
| Total | 87 | 37 | 43% | 50 | 57% | 1 |
You will see that their all-time home winning percentage drops 4 points to 60% when adding in the campus stadium.
So what does this all mean? Well, it means that Auburn has won roughly the same (actually better) percentage of home games as Alabama has, but Alabama just got to play 51 (FIFTY ONE) more home games. The 67 home games amount to 77% of the games in the series. Over 3/4 of the games have been played where Alabama calls/called home. Why wouldn’t they lead?
So if the home field advantages are roughly the same (I’m throwing Montgomery out because that’s never been considered a home game for either team and it’s split 2-2 anyway), then we should split all of those extra home games Alabama got and apply the winning percentages to those. Let’s do that.
As I said, Alabama has played 51 more games than Auburn in what was considered their home stadium. To make it an easier split, and considering one of those ended in a tie, let’s just call it 50. So we have 50 games that should have been split into 25 games in Auburn and 25 games in Birmingham/Tuscaloosa.
If we apply Auburn’s 59% home game winning percentage to their newly acquired 25 home games, their record in those games would be 14.75-9.25, or roughly 15-10.
If we apply Alabama’s 62% home game winning percentage to their newly adjusted 25 home games, their record in those games would be 15.5-9.5, or roughly 15-10 (of a lesser kind).
Now let’s re-crunch the numbers with adjusted home game amounts and calculate those against home game winning percentages. You will see below that AT WORST the series would be split.
| Location | Games | AUB | Win % | ALA | Win % | Ties |
| Bham/Tuscaloosa | 42 | 15 | 38% | 26 | 62% | 1 |
| Auburn | 41 | 26 | 59% | 16 | 41% | 0 |
| Montgomery | 4 | 2 | 50% | 2 | 50% | 0 |
| Total | 88 | 43 | 49% | 44 | 50% | 1 |
I know the whole “Legion field wasn’t a neutral site” thing has been argued so many times that Alabama fans blow it off (see: national championships), but in what world is it right or fair that a team that had their team colors painted on that field most of the season, in a city where Alabama-hood runs wild, gets to play their rival there for over 2/3 of the series?

And honestly, with the actual numbers how does Alabama only have a 10-game lead in the series with over 50 more home games? Here’s why: because in home games, Auburn has a better record, and if they were given the opportunity to at least split those home games, based on the math, Auburn would lead the series.
The truth is in the numbers. Even with Nick Saban’s dominance, Alabama only leads the series 16-14 since the game officially started rotating between Auburn and Birmingham/Tuscaloosa in 1993. Note: the first game in Auburn was 1989, but Alabama got three more consecutive Birmingham Iron Bowls after that.
I realize that was a lot of math, and many gave up on it a long time ago, but here it is in a TL;DR (that means “too long; didn’t read”) form.
- Alabama has played in what was considered their home stadium 51 more times than Auburn in the Iron Bowl.
- Alabama has won 62% of their home games in the Iron Bowl.
- Auburn has won 59% of their home games in the Iron Bowl.
- If you split the extra home games given to Alabama, and multiply them by the winning percentages of each team, the math shows that Auburn would have been more likely to win more games than Alabama.
- Adjusting the series record based on those new numbers has the series almost split perfectly at 43-44-1.
Note: since this was originally written in 2019, Auburn is 1-4 in Iron Bowls. After Auburn’s win in 2019, Auburn held a 3-game advantage in the corrected record. Alabama has taken a one game lead in the corrected series record with 4 straight wins.


3 comments
Bear would beat Shug Jordan in a Walmart parking lot yet real
No. Just… No.
Auburn owns the Iron Bowl in the make believe world of extrapolated math you have in your head.
Meanwhile, in the real world…
We’ll show you Saturday when we print another, yet better, bumper sticker saying honk your horn if you’ve sacked Mac Jones, or whatever his short lived QB name is. Say bye bye to free ride to play-offs like in 2017!! No sec west camp and no SEC champ. And walk right into playoffs. Horse Sh-t at best. GA OR LSU WIN OR LOSE GET IN.